
티스토리 뷰
요새 경제 지표를 차트로 만들어보려고 이것저것 찾아보다, dash 라는 걸 알게 되었다.
파이썬만으로 interactive 한 Data chart 를 만들 수 있는게 매력적이었다.
그런데 아직 pandas 나 numpy 등 인기있는 파이썬 패키지처럼 널리 쓰이지 않고 있고 계속 개발중이다보니,
아나콘다로 설치하는 과정이 한번에 되지는 않아서 정리하려고 글을 쓴다.
1. anaconda 설치 (2022.11.10 기준 최신 설치 파일 함. window 기준)
: https://docs.anaconda.com/anaconda/install/windows/#
Installing on Windows — Anaconda documentation
Go to your Downloads folder and double-click the installer to launch. To prevent permission errors, do not launch the installer from the Favorites folder. Note If you encounter issues during installation, temporarily disable your anti-virus software during
docs.anaconda.com
2. dashboard 라는 이름의 가상환경 만들어줌
conda create -n dashboard
3. 가상환경 리스트 출력하여 제대로 만들어졌는지 확인
conda env list
4. 만든 dashboard 가상 환경 activate
conda activate dashboard5. jupyter lab 커널에 생성한 dashboard 가상환경 커널 추가
#ipykernel 설치
conda install ipykernel

#가상환경 커널 추가
#python -m ipykernel install --user --display-name [표시할 커널이름] --name [가상환경이름]
#실제 예
python -m ipykernel install --user --display-name dashboard --name dashboard
5. pandasm dash 설치
conda install pandas
conda install dash
6. jupyte lab 실행
: 커맨드 창이나 anaconda prompt 창에서 아래 입력하면 jupyter lab 이 실행됨
jupyter lab7. 아래 코드 입력
from dash import Dash

import dash_core_components as dcc
import dash_html_components as html
from dash.dependencies import Input, Output

import pandas as pd
import plotly.express as px


app = Dash(__name__)

# assume you have a "long-form" data frame
# see https://plotly.com/python/px-arguments/ for more options
df = pd.DataFrame({
    "Fruit": ["Apples", "Oranges", "Bananas", "Apples", "Oranges", "Bananas"],
    "Amount": [4, 1, 2, 2, 4, 5],
    "City": ["SF", "SF", "SF", "Montreal", "Montreal", "Montreal"]
})

fig = px.bar(df, x="Fruit", y="Amount", color="City", barmode="group")

app.layout = html.Div(children=[
    html.H1(children='Hello Dash'),

    html.Div(children='''
        Dash: A web application framework for your data.
    '''),

    dcc.Graph(
        id='example-graph',
        figure=fig
    )
])

if __name__ == '__main__':
    app.run_server(debug=False)
8. 추가한 커널(dashboard) 지정하여 실행시킴
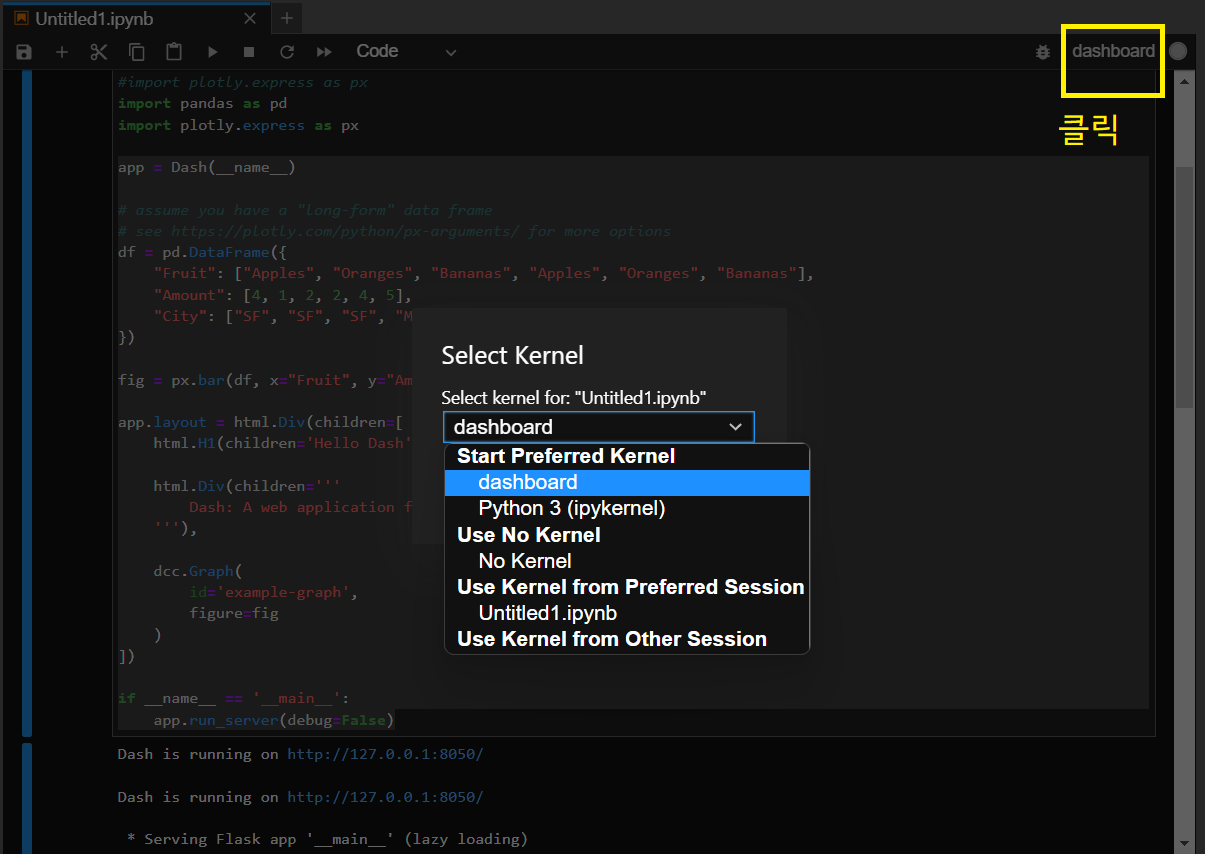
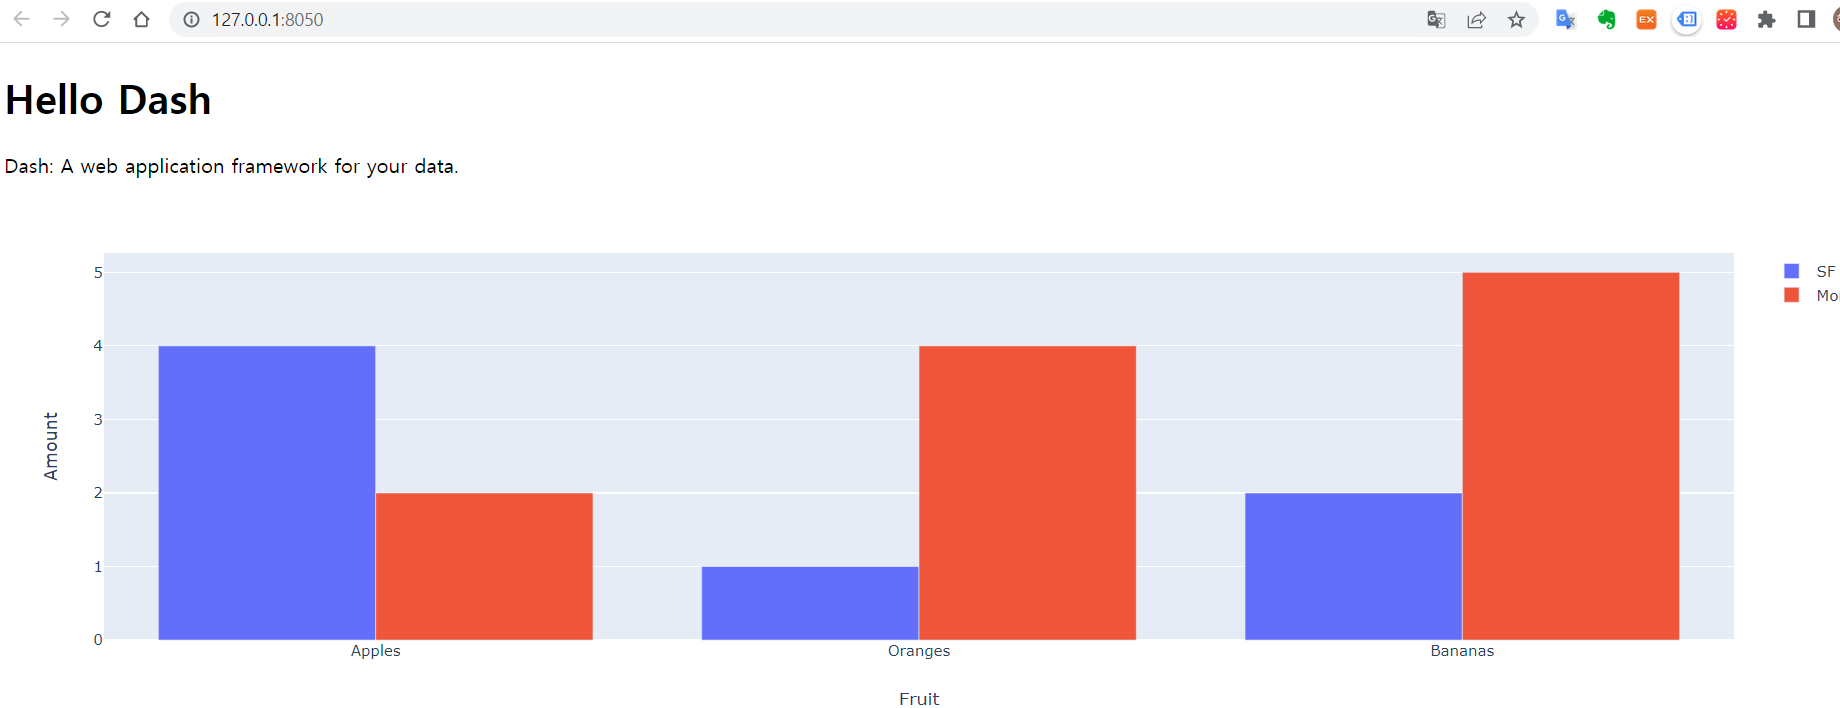
9. http://127.0.0.1:8050/ 으로 실행 확인
추후 더 살펴볼 것.
1) dash 설치 시, 채널을 conda forge 로 설치 시 설치 과정이 조금 다름. 아마 올라간 버전이 차이가 있는 듯
2) jupyterlab-dash 를 설치하면 좀 더 쉽게 개발할수 있다고 하는데 app 기본 개발 코드에 익숙해 지고, 사용해볼 것
: jupyter lab 의 좌측 extension 버튼을 눌러 설치 가능한 extension 검색으로 설치함. (jupyterlab-dash 는 아직 window 버전에서는 지원안한다고 함)
3) app.run_server(debug=False) 를 app.run_server(debug=True) 로 변경해서 사용할 수 있는 방법이 있는지 찾아볼것.
(True 로 변경하면, 코드 변경 사항이 바로바로 차트에 반영되어 결과를 쉽게 확인할 수 있음.
현재 jupyterlab 에서는 True 로 변경 시 동작 안함. )
'대쉬보드' 카테고리의 다른 글
| Xpath 와 CSS Selector 기본 문법 (0) | 2022.11.04 |
|---|
- Total
- Today
- Yesterday
- 통화량 데이타
- 주소를 위경도 변환
- 연금등록
- 마연굴
- 프로그래스바 표시
- 환율데이터
- dash
- 연금저축
- Dash.html
- 리치고
- 블록해쉬
- 블록해쉬구현
- ChatGPT
- 계정조정계열
- 원계열
- 내 연금조회
- 객사오
- M1/M2
- Dash 와 html 차이
- 위경도변환
- 환매시점
- pandas apply
- M1M2비율
- 김성일 작가님
- Forgiving
- 말잔
- 리치고 주식
- 경제주체별 M2
- 환율이평선
- 경제는 어떻게 움직이는가
| 일 | 월 | 화 | 수 | 목 | 금 | 토 |
|---|---|---|---|---|---|---|
| 1 | 2 | 3 | ||||
| 4 | 5 | 6 | 7 | 8 | 9 | 10 |
| 11 | 12 | 13 | 14 | 15 | 16 | 17 |
| 18 | 19 | 20 | 21 | 22 | 23 | 24 |
| 25 | 26 | 27 | 28 | 29 | 30 | 31 |